


How everyday items have risen in price in the past 12 months
Register for free to read more of the latest local news. It's easy and will only take a moment.
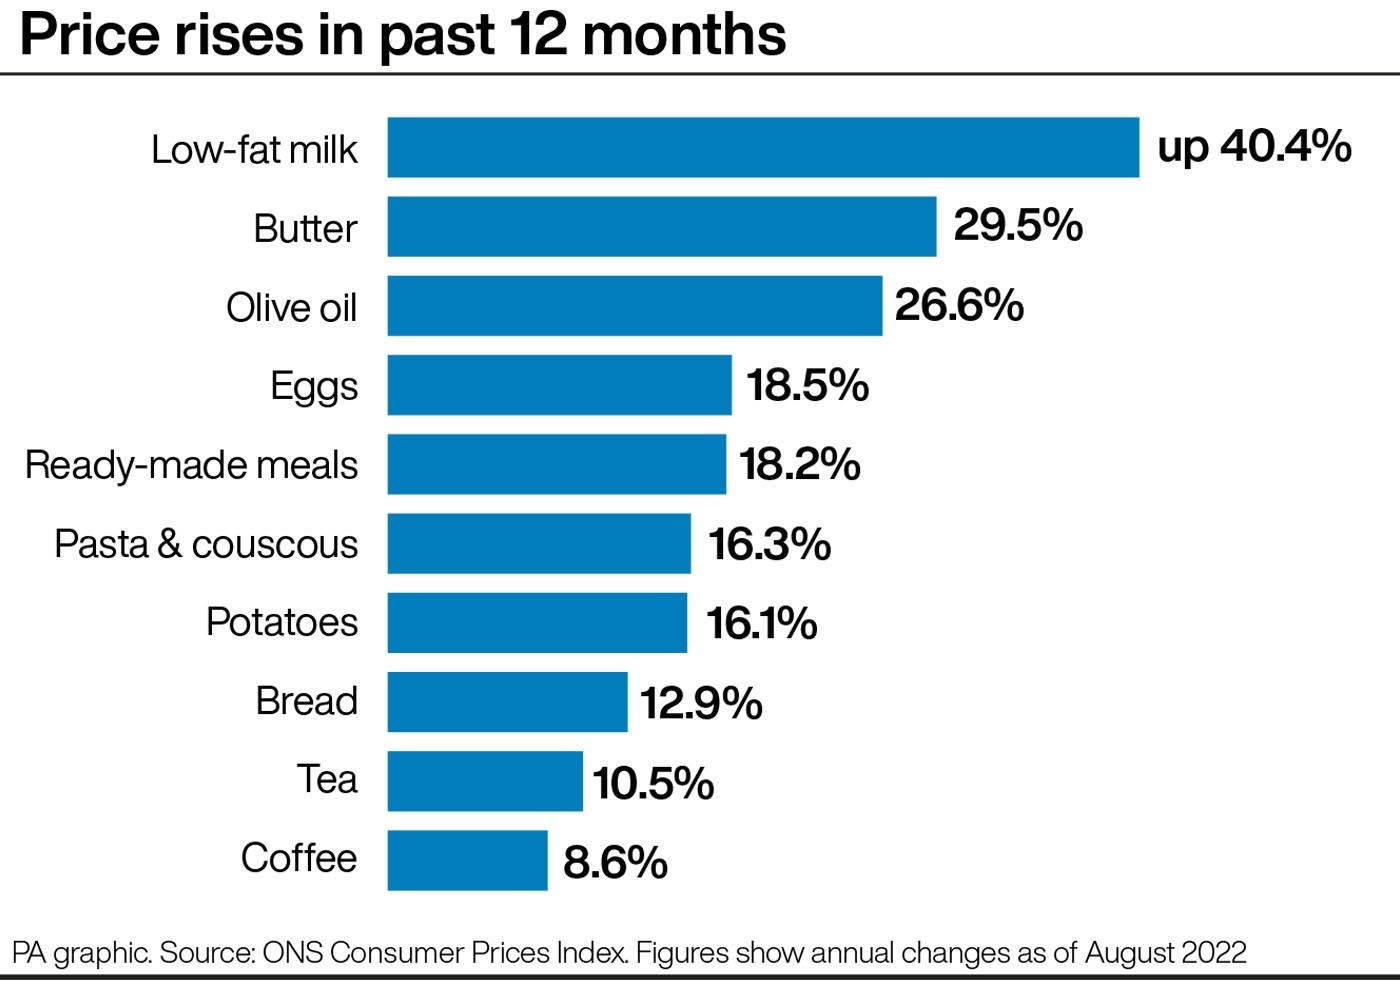
Here are some examples of how the cost of everyday goods and services has risen in the past year.
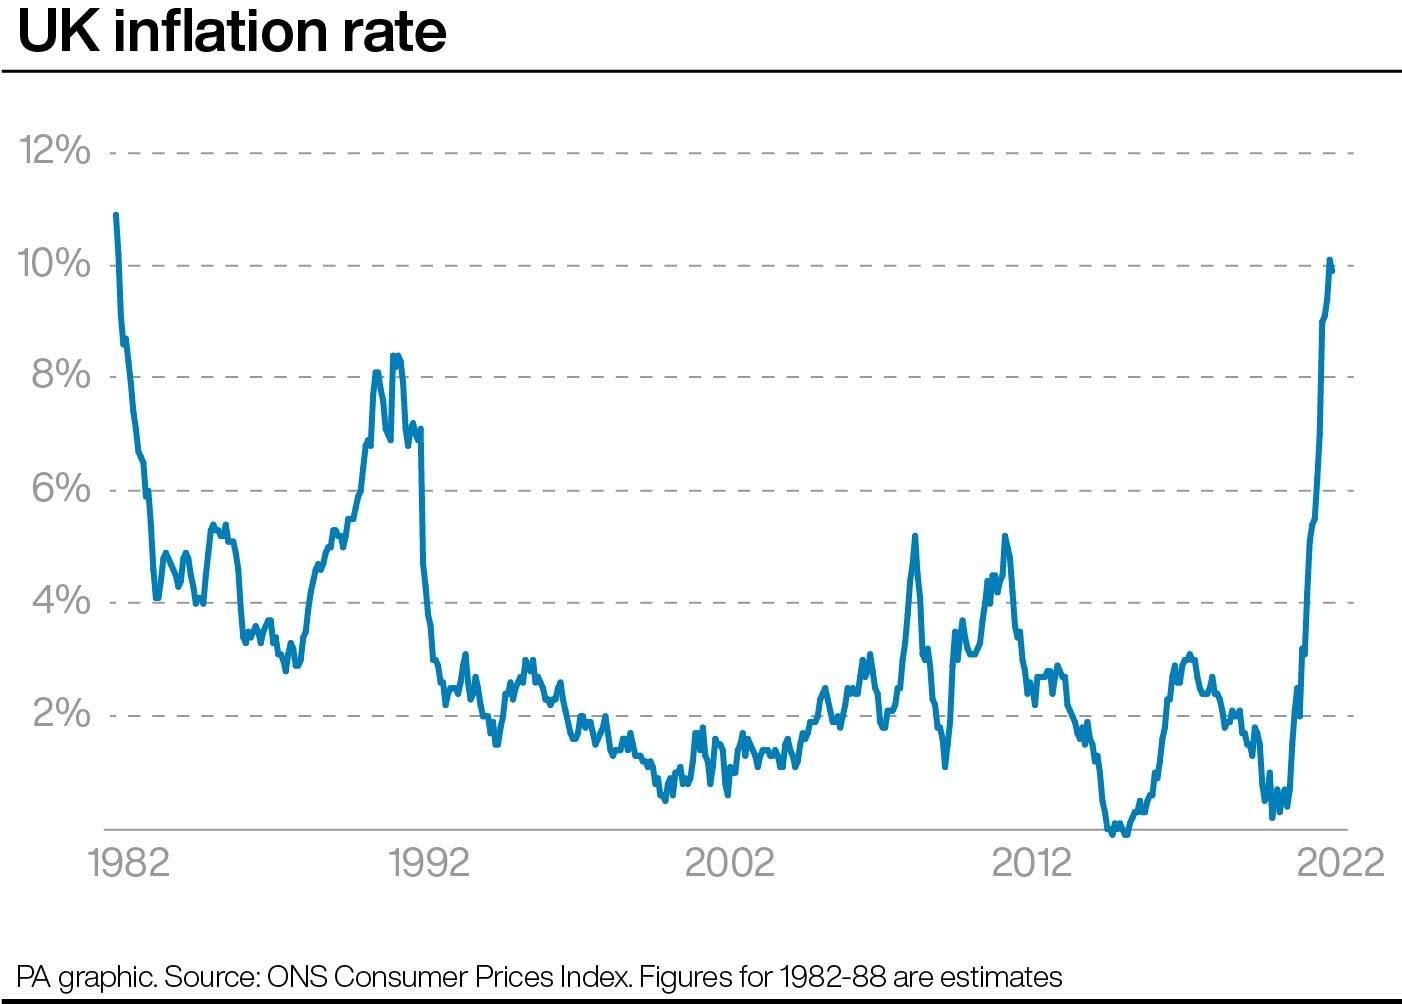
The figures are based on the Consumer Prices Index (CPI) measure of inflation and have been published by the Office for National Statistics.
In each case, the figure is the percentage change in the average price over the 12 months to August 2022.
– Food
Low-fat milk 40.4%
Butter 29.5%
Jams, marmalades and honey 29.1%
Olive oil 26.6%
Margarine and other vegetable fats 25.6%
Sauces, condiments, salt, spices and culinary herbs 22.6%
Cheese and curd 21.0%
Pizza and quiche 18.6%
Eggs 18.5%
Ready-made meals 18.2%
Pasta and couscous 16.3%
Potatoes 16.1%
Fish 14.1%
Crisps 13.1%
Bread 12.9%
Fresh or chilled fruit 9.4%
Rice 9.1%
Sugar 5.8%
– Drinks
Mineral or spring waters 20.9%
Fruit and vegetable juices 11.4%
Tea 10.5%
Coffee 8.6%
Soft drinks 7.6%
Beer 4.1%
Spirits 3.7%
Wine 1.8%
– Clothing and shoes
Garments for men 9.2%
Clothing accessories 8.2%
Footwear for infants and children 7.9%
Garments for women 7.6%
Footwear for women 7.3%
Garments for infants and children 6.6%
Footwear for men 3.8%
– Electricity, gas and other fuels
Gas 95.7%
Liquid fuels 86.2%
Electricity 54.0%
Solid fuels 29.8%
– Household items and furniture
Garden furniture 16.3%
Irons 12.7%
Cookers 12.2%
Glassware and chinaware 11.6%
Refrigerators, freezers and fridge-freezers 11.3%
Lighting equipment 8.5%
Bed linen 7.0%
Carpets and rugs 7.0%
– Vehicles
New cars 6.6%
Bicycles 5.8%
Second-hand cars 4.6%
Motorcycles 2.2%
– Passenger transport
By air 40.3%
By train 9.2%
By bus and coach 8.8%
By underground and tram 5.1%
– Hospitality and recreation
Holiday centres, camping sites and youth hostels 15.5%
Fast-food and takeaway food services 11.1%
Restaurants and cafes 8.3%
Canteens 6.4%
Cinemas, theatres and concerts 5.9%
Museums, libraries and zoological gardens 5.0%
– Other recreational items
Products for pets 15.0%
Garden products 14.9%
Equipment for sport 13.2%
Veterinary and other services for pets 9.4%
Plants and flowers 7.2%