


What the latest NHS performance figures show
Register for free to read more of the latest local news. It's easy and will only take a moment.
Ambulance response times have improved and a key cancer target has been exceeded two months in a row, but there has been no drop in the number of people waiting for hospital treatment.
Here are the main figures from the latest NHS performance data for England:
– Overall waiting list
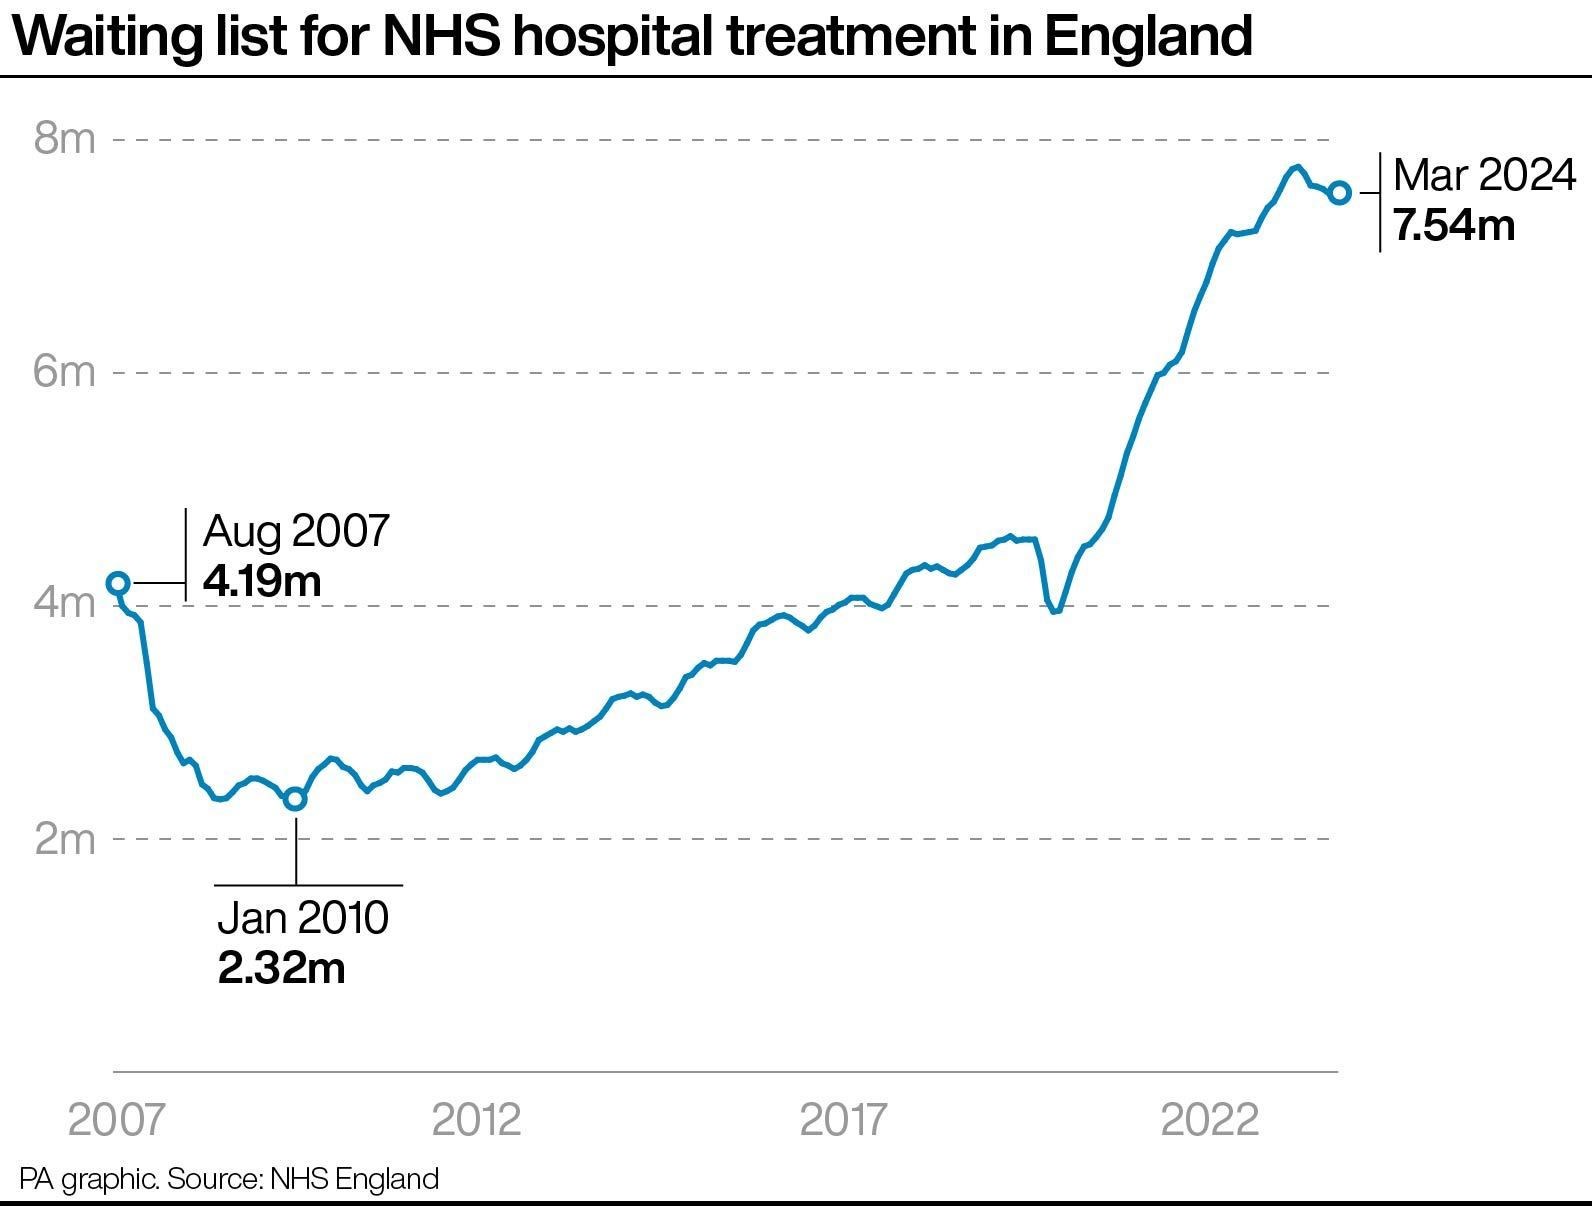
The size of the waiting list for routine hospital treatment is unchanged, bringing to an end a run of five consecutive monthly falls.
An estimated 7.54 million treatments were waiting to be carried out at the end of March, relating to 6.29 million patients, the same numbers as in February.
The list hit a record high in September 2023 with 7.77 million treatments and 6.50 million patients.
It has been on an upwards path for much of the last 10 years, passing three million in 2014, four million in 2017, five million in 2021 and seven million in 2022.
In February 2020, the last full month before the start of the Covid-19 pandemic, the list stood at 4.57 million.
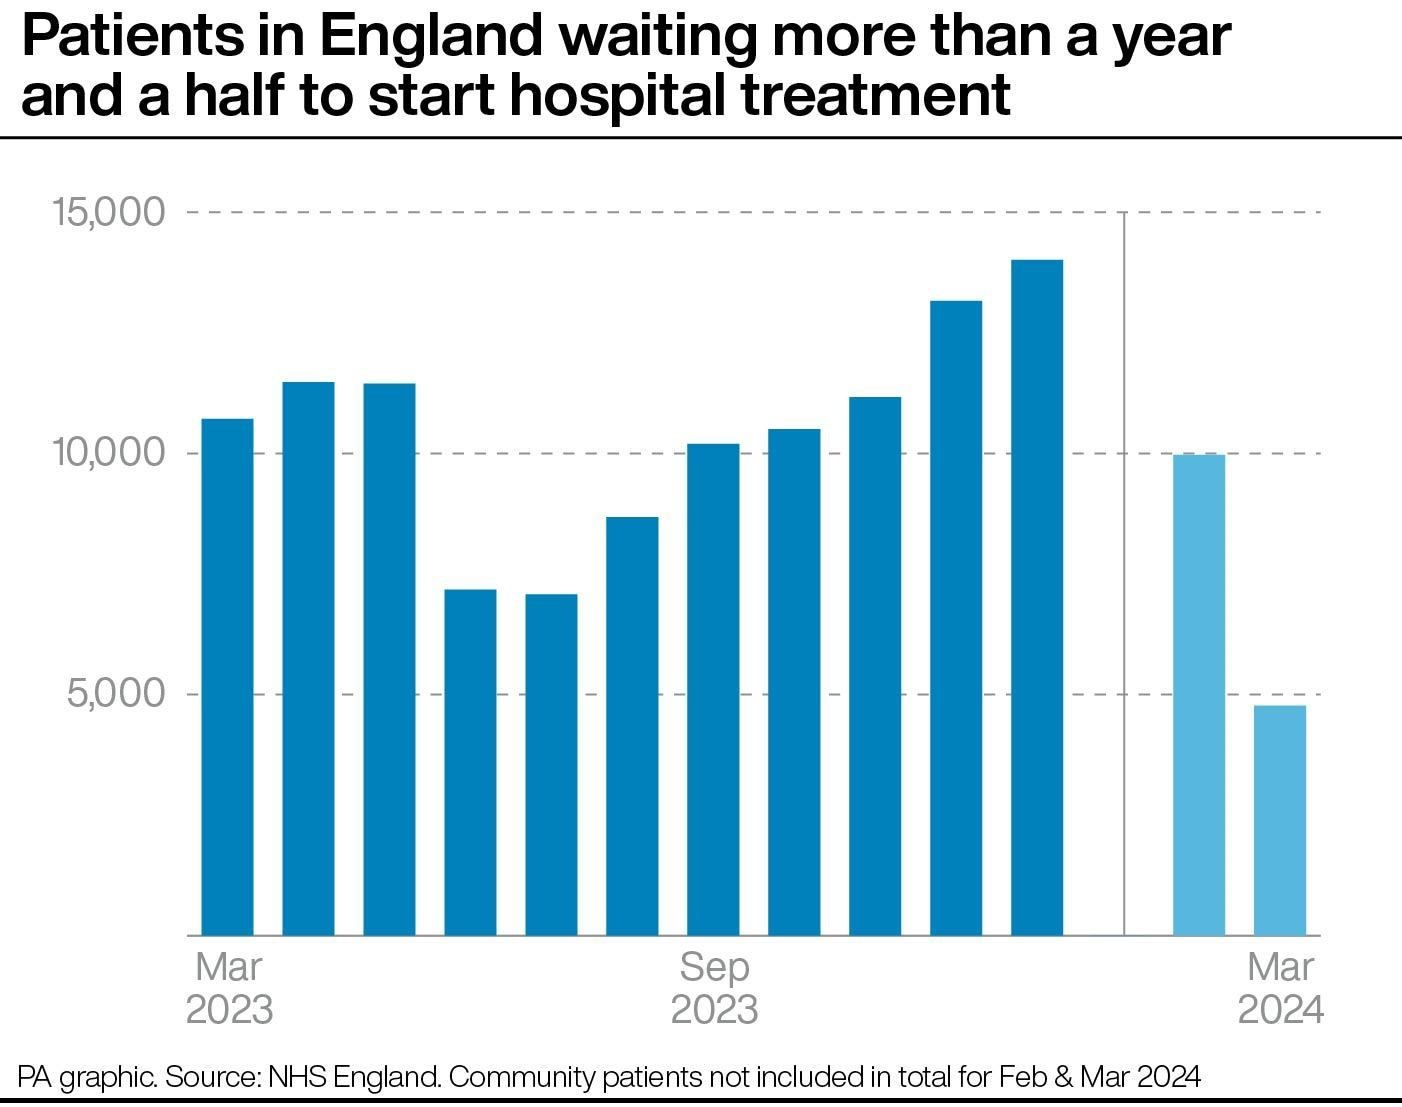
Nearly 43,000 incidences of people waiting for treatment are likely to have been excluded from the waiting list for March, including some of the patients who have been waiting the longest.
This is due to a change in the way the figures are reported, with treatments by community services no longer included in the data.
Community services cover treatments and procedures that are delivered mainly in people’s homes, as well as care homes, clinics, schools, other care facilities and community hospitals.
– Long waits for treatment
Some 4,770 patients had been waiting more than 18 months to start routine treatment at the end of March, down from 9,969 in February.
The Government and NHS England set the ambition of eliminating all waits of more than 18 months by April 2023, excluding exceptionally complex cases or patients who choose to wait longer.
There were 48,968 patients who had been waiting more than 65 weeks to start treatment at the end of March, down from 75,004 in February.
The target to eliminate all waits of over 65 weeks is now September 2024, having previously been March of this year.
Meanwhile, 309,300 people had been waiting more than 52 weeks to start treatment at the end of March, up from 305,050 at the end of February.
The target to eliminate all waits of more than a year is March 2025.
– Accident & emergency waits
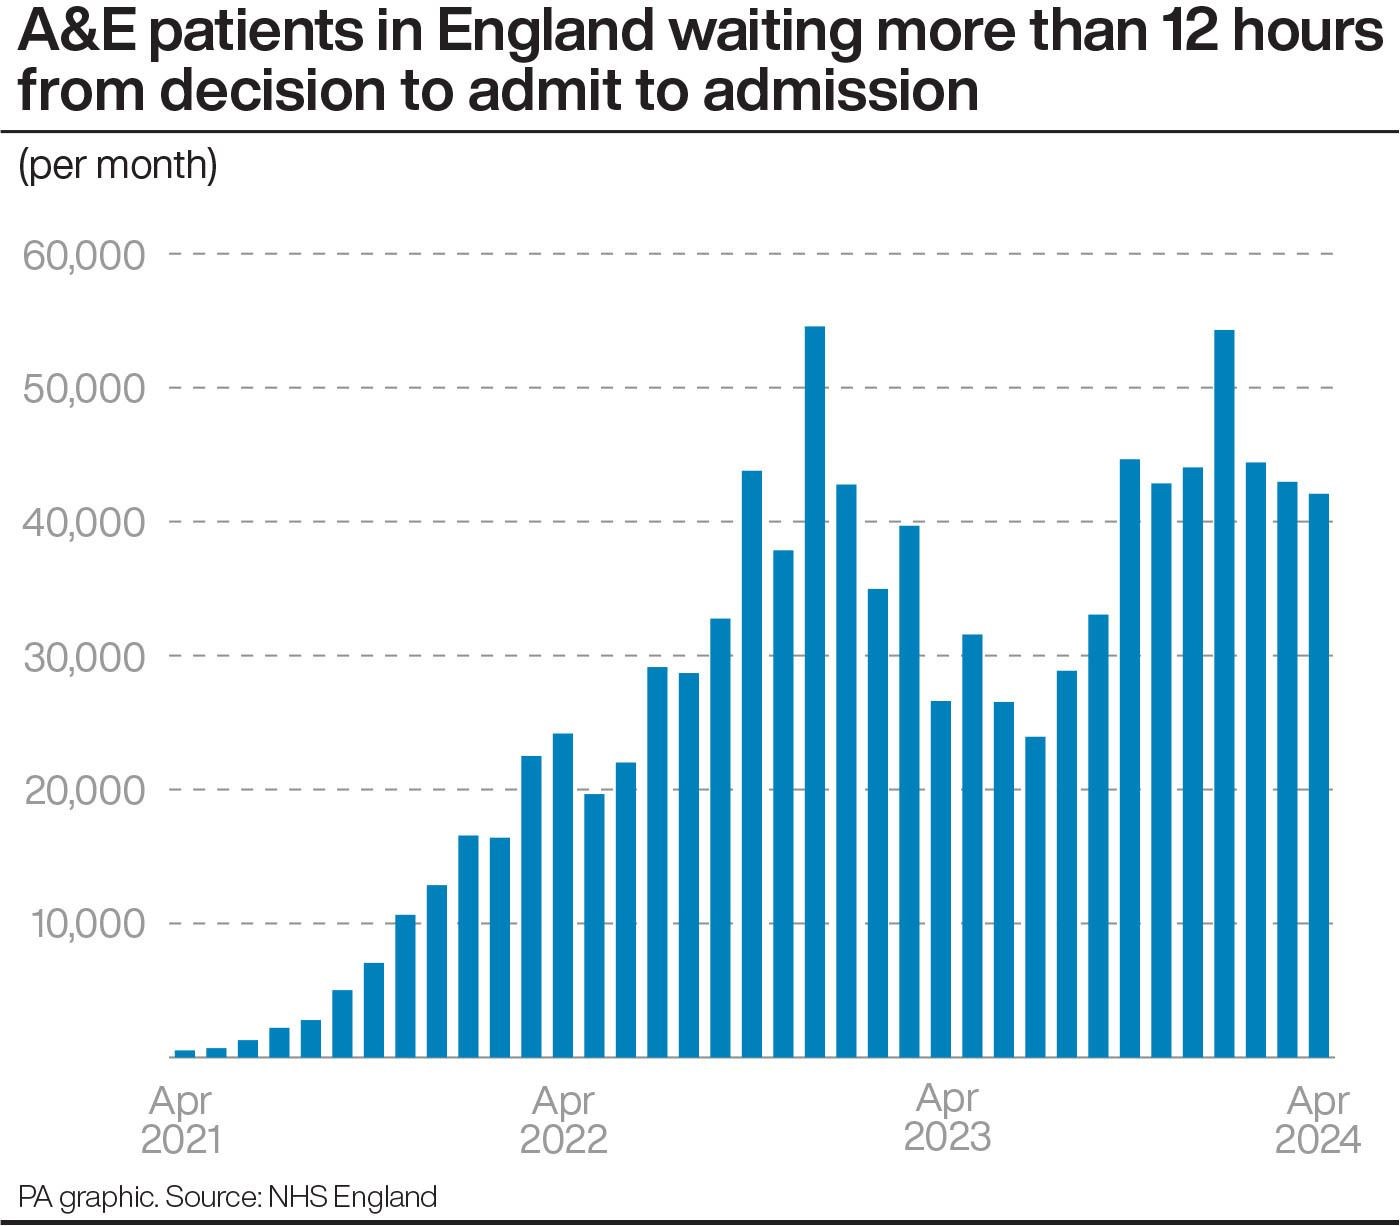
Some 42,078 people had to wait more than 12 hours in A&E departments in April from a decision to admit to actually being admitted, down slightly from 42,968 in March.
The record high for a calendar month is 54,573, which occurred in December 2022.
The number waiting at least four hours from the decision to admit to admission fell from 140,181 in March to 134,344 in April.
Meanwhile, 74.4% of patients were seen within four hours in A&Es last month, up from 74.2% in March and the highest figure since April 2023.
The NHS recovery plan set a target of March this year for 76% of patients attending A&E to be admitted, transferred or discharged within four hours.
– Cancer referrals
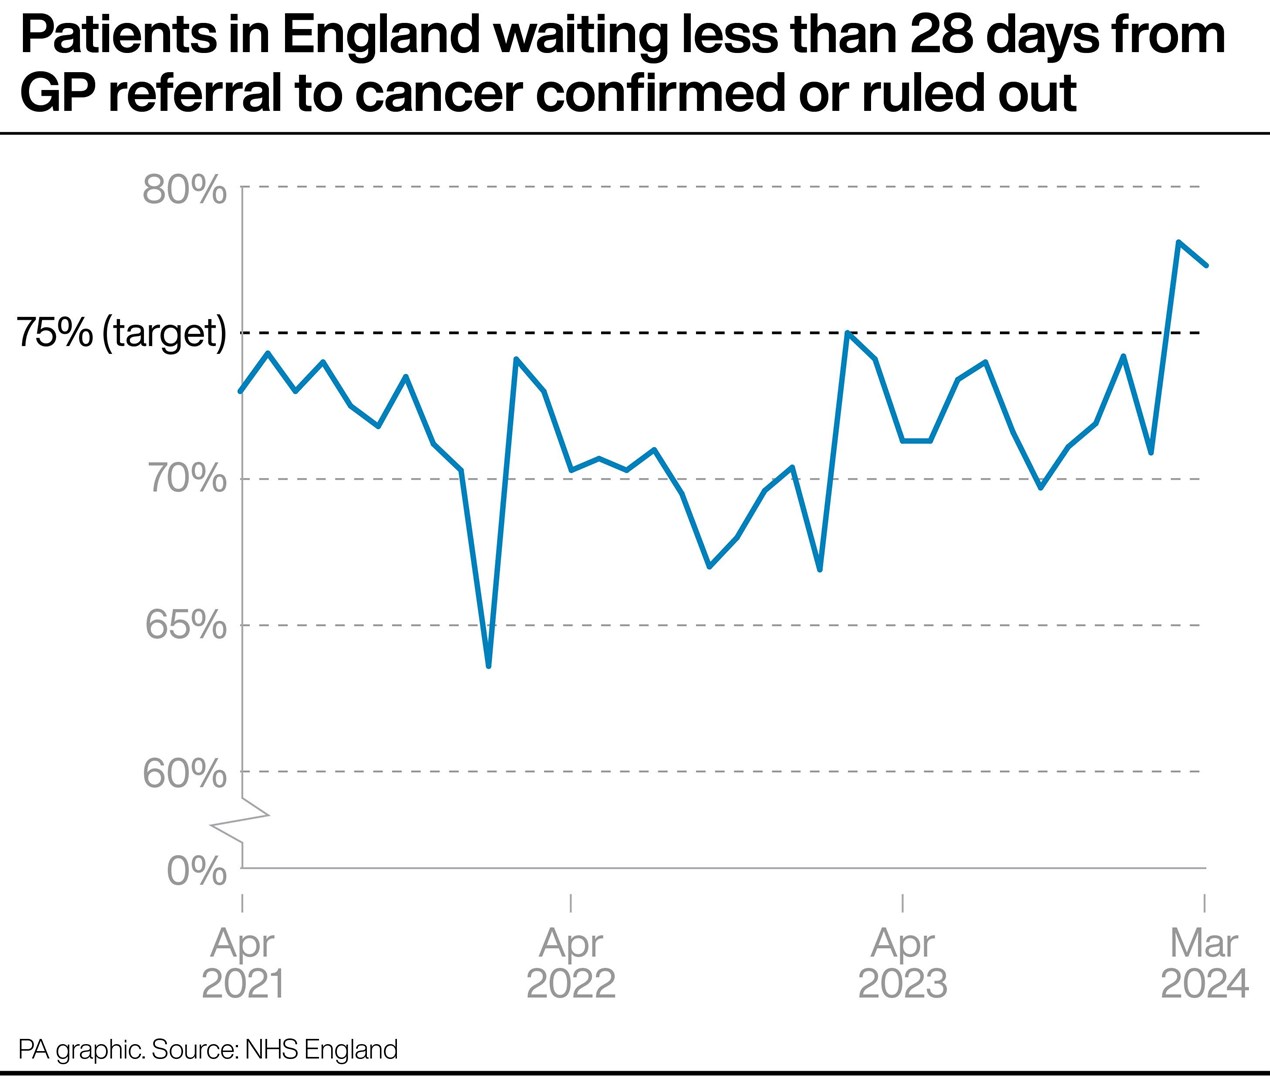
A total of 77.3% of patients urgently referred for suspected cancer in March were diagnosed or had cancer ruled out within 28 days.
This is down from 78.1% the previous month, but is the second time in a row the target of 75% has been exceeded.
The proportion of patients waiting no longer than 62 days in March from an urgent suspected cancer referral or consultant upgrade to their first definitive treatment for cancer was 68.7%, up from 63.9% in February.
The target is 85%.
GPs in England made 254,594 urgent cancer referrals in March, up slightly from 253,025 in February but down year on year from 260,560 in March 2023.
– Cancer diagnostic waiting list
The number of patients in England waiting longer than 62 days since an urgent GP referral for suspected cancer was 14,916 in the week ending March 31 2024, down from 19,520 in the week ending February 25.
The figure was nearly 34,000 at the end of September 2022.
Most of the patients included in this total do not have cancer and are waiting for a diagnostic test, while around one in five do have cancer and are waiting for treatment.
The Government and NHS England set the ambition of returning this figure to pre-pandemic levels by March 2023.
The average weekly figure for the pre-pandemic month of February 2020 (covering the four weeks to March 1) was 13,463.
– Ambulance response times
The average response time in April for ambulances dealing with the most urgent incidents, defined as calls from people with life-threatening illnesses or injuries, was eight minutes and 10 seconds.
This is down slightly from eight minutes and 20 seconds in March and is the fourth monthly fall in a row, but is above the target standard response time of seven minutes.
Ambulances took an average of 30 minutes and 22 seconds last month to respond to emergency calls such as heart attacks, strokes and sepsis.
This is down from 33 minutes and 50 seconds in March, while the target is 18 minutes.
Response times for urgent calls, such as late stages of labour, non-severe burns and diabetes, averaged one hour, 42 minutes and 13 seconds in April, down from two hours, three minutes and 47 seconds in March.